无法交付
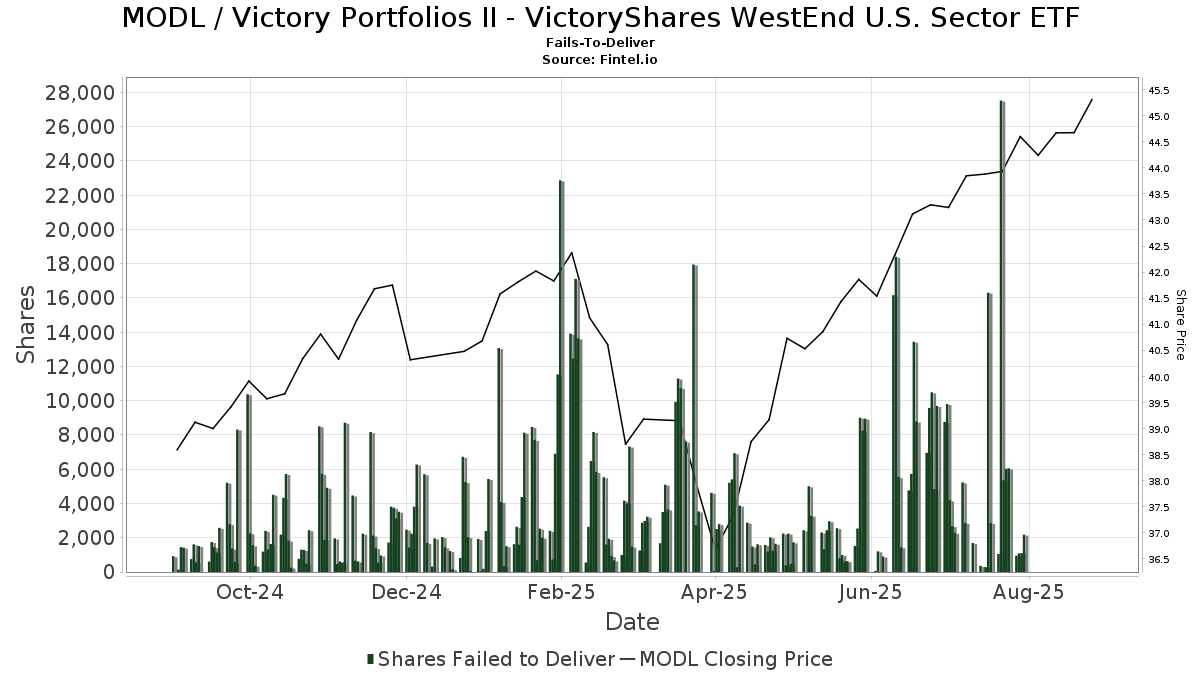
无法交付股份总额代表截至特定结算日无法交付股份的总净余额。在给定的一天无法交付是指当天之前所有无法交付的累积数量,加上当天发生的新无法交付,减去当天解决的无法交付。该数字不是每日无法交付次数,而是包括报告日新无法交付和现有无法交付的组合数字。换言之,这些数字反映了截至特定时间点的总无法交付,可能与昨天的总无法交付几乎没有关系。因此,需要注意的是,不能通过查看这些数字来确定无法交付的时间长短如果所有股票都是在某一天交付的,那么表中就没有条目了。
更新频率:美国证券交易委员会(SEC)分批发布每日数据,每月两次,滞后约两周。例如,3月份的每日数据将在4月中旬左右到达。
| 日期 | 价格 | 数量 | 价值 |
|---|---|---|---|
| 44.60 | 2,180 | 97,228.00 | |
| 44.50 | 1,105 | 49,172.50 | |
| 44.04 | 1,085 | 47,783.40 | |
| 44.15 | 951 | 41,986.65 | |
| 43.79 | 6,053 | 265,060.87 | |
| 43.93 | 6,030 | 264,897.90 | |
| 43.64 | 5,359 | 233,866.76 | |
| 43.88 | 27,527 | 1,207,884.76 | |
| 43.20 | 1,055 | 45,576.00 | |
| 43.83 | 2,854 | 125,090.82 | |
| 43.88 | 16,312 | 715,770.56 | |
| 43.90 | 285 | 12,511.50 | |
| 44.07 | 359 | 15,821.13 | |
| 43.92 | 1,695 | 74,444.40 | |
| 43.53 | 2,872 | 125,018.16 | |
| 43.42 | 5,232 | 227,173.44 | |
| 43.41 | 2,276 | 98,801.16 | |
| 43.24 | 2,677 | 115,753.48 | |
| 43.07 | 4,182 | 180,118.74 | |
| 43.30 | 9,803 | 424,469.90 | |
| 43.17 | 8,765 | 378,385.05 | |
| 43.33 | 9,697 | 420,171.01 | |
| 43.29 | 4,839 | 209,480.31 | |
| 43.09 | 10,491 | 452,057.19 | |
| 43.13 | 9,579 | 413,142.27 | |
| 43.50 | 6,958 | 302,673.00 | |
| 43.12 | 8,784 | 378,766.08 | |
| 42.97 | 13,446 | 577,774.62 | |
| 43.10 | 5,724 | 246,704.40 | |
| 42.80 | 4,765 | 203,942.00 | |
| 42.61 | 1,446 | 61,614.06 | |
| 42.32 | 5,546 | 234,706.72 | |
| 42.26 | 18,402 | 777,668.52 | |
| 41.76 | 16,165 | 675,050.40 | |
| 41.54 | 902 | 37,469.08 | |
| 41.57 | 1,206 | 50,133.42 | |
| 41.93 | 63 | 2,641.59 | |
| 41.99 | 8,953 | 375,936.47 | |
| 41.86 | 8,254 | 345,512.44 | |
| 41.98 | 9,007 | 378,113.86 | |
| 41.71 | 2,542 | 106,026.82 | |
| 41.72 | 1,522 | 63,497.84 | |
| 41.24 | 633 | 26,104.92 | |
| 41.43 | 605 | 25,065.15 | |
| 41.38 | 995 | 41,173.10 | |
| 41.22 | 805 | 33,182.10 | |
| 41.05 | 2,557 | 104,964.85 | |
| 40.96 | 2,964 | 121,405.44 | |
| 40.86 | 2,440 | 99,698.40 | |
| 41.04 | 1,330 | 54,583.20 |